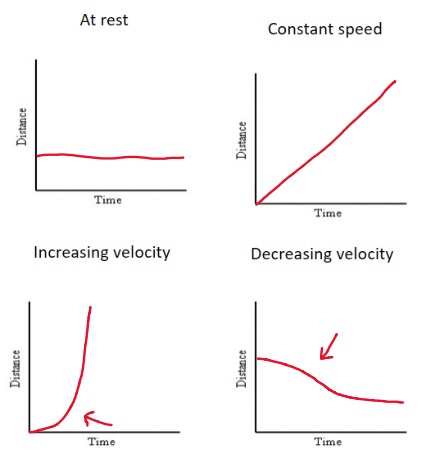
Distinguish between constant velocity, increasing velocity and decreasing velocity on graphs
Determine the velocity of an object
| Description of motion | Time (s) | Cumulative time (s) | Distance (m) | Distance from start (m) |
|---|---|---|---|---|
| still | 0 | 0 | 0 | 0 |
| Walk | 7.72 | 7.72 | 10 | 10 |
| Run | 3.15 | 10.87 | 10 | 20 |
| Stop | 10 | 20.87 | 0 | 20 |
| Walk | 6 | 26.87 | 10 | 30 |
| Jog | 4.87 | 31.74 | 10 | 40 |
| Run | 2.9 | 34.64 | 10 | 50 |
| Walk | 7.13 | 41.77 | 10 | 60 |
| N/E/S/W | ||||
| Make sure to use displacement not distance when calculating velocity. Here, they are the same. |
Describe specific ways to improve the validity and reliability of the data
Construct and analyse a range of distance-time graphs
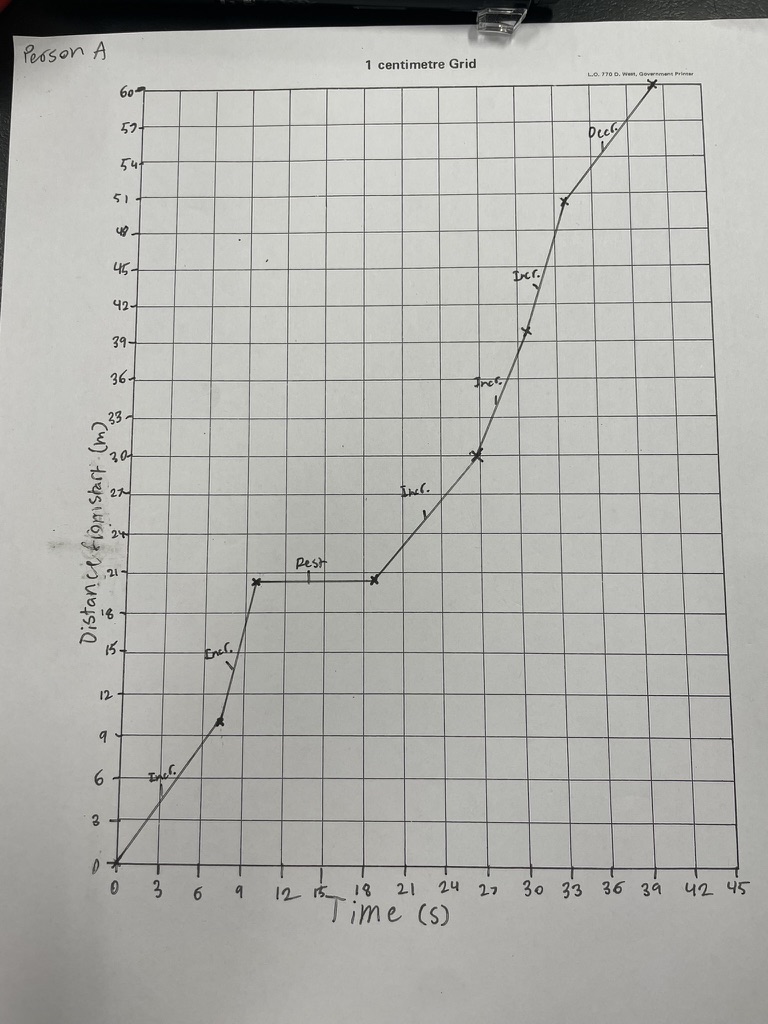
| Person A | ||||
|---|---|---|---|---|
| Description of motion | Time (s) | Cumulative time (s) | Distance (m) | Distance from start (m) |
| still | 0 | 0 | 0 | 0 |
| Walk | 7.72 | 7.72 | 10 | 10 |
| Run | 3.15 | 10.87 | 10 | 20 |
| Stop | 10 | 20.87 | 0 | 20 |
| Walk | 6 | 26.87 | 10 | 30 |
| Jog | 4.87 | 31.74 | 10 | 40 |
| Run | 2.9 | 34.64 | 10 | 50 |
| Walk | 7.13 | 41.77 | 10 | 60 |
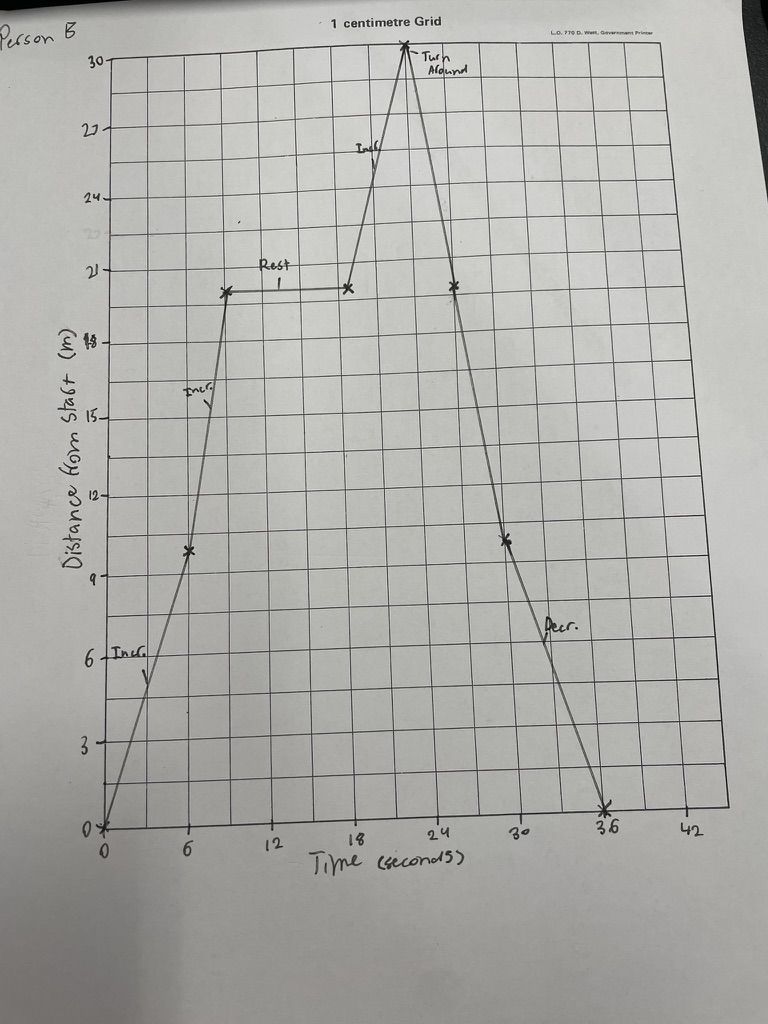
| Person B | ||||
|---|---|---|---|---|
| Description of motion | Time (s) | Cumulative time (s) | Distance (m) | Distance from start (m) |
| still | 0 | 0 | 0 | 0 |
| Walk | 6 | 6 | 10 | 10 |
| Run | 3.16 | 9.16 | 10 | 20 |
| Stop | 10 | 19.16 | 0 | 20 |
| Walk | 5.16 | 24.32 | 10 | 30 |
| Turn around and jog | 3.03 | 27.35 | 10 | 20 |
| Run | 2.63 | 29.98 | 10 | 10 |
| Walk | 5.79 | 35.77 | 10 | 0 |
Analyse a distance time graph
Examples
When is Person A at rest?
From 10-19 seconds
When is Person B at rest?
From 12-20 seconds
When is Person A increasing their velocity?
Well, it’s not really a detailed graph, but probably at 0, 10, 27, 31, 34.